DBT Models
This section outlines the DBT models used in the project, explaining how raw data in the form of FHIR resources was transformed into tables used in the dashboard. DBT was chosen because it fits well with SQL-based workflows, enforce modular and reusable code through the use of models and macros. It also provides useful features like documentation and lineage tracking, which made it easier to maintain and understand the project structure. The code for the DBT project can be found on GitHub: open-mnch-dbt-analytics
Transformations
The FHIR resources (located in the “base_reports” folder at the root) are first transformed into two models patient_timeline and patient_info which serve as the base models for all other downstream models used in calculating value points.
patient_timeline: The model ingests a parquet file containing a patient timeline and transforms it into a dataframe. The patient timeline contains records of patient encounters extracted from FHIR resources. The model is located atmodels/base_reports/br_timeline/patient_timeline.pypatient_info: The model processes a parquet file, which contains information such as patient unique identifier (patient_id), and date of birth extracted frompatientFHIR resource and transforms it into a dataframe. The model can be found atmodels/base_reports/br_timeline/patient_info.py
These models are then transformed and combined into a single dataset patient timeline combined, which serves as a building block for subsequent models used in calculating value points. The transformations applied to the base models include, filtering the patient events data based on age, and adding information that flags high-risk patients based on their captured conditions. The code for the intermediary models used to create the patient_timeline_combined can be found at models/value_points/staging.
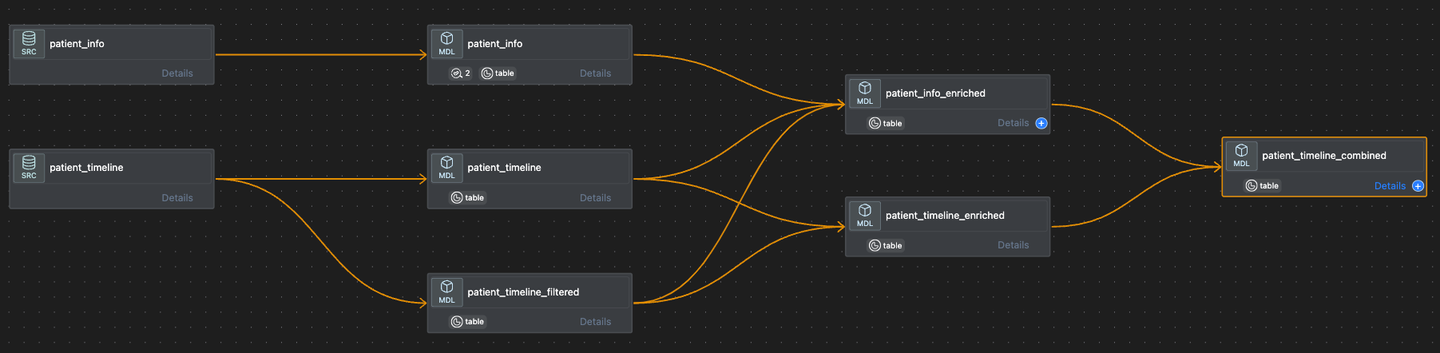
The code below is used to create the patient_timeline_combined based on the intermediary models patient_info_enriched and patient_timeline_enriched
{{
config(
materialized = 'table',
on_schema_change = 'fail'
)
}}
SELECT
pi.*,
pt.*
FROM
{{ ref('patient_info_enriched') }} AS pi
INNER JOIN
{{ ref('patient_timeline_enriched') }} AS pt
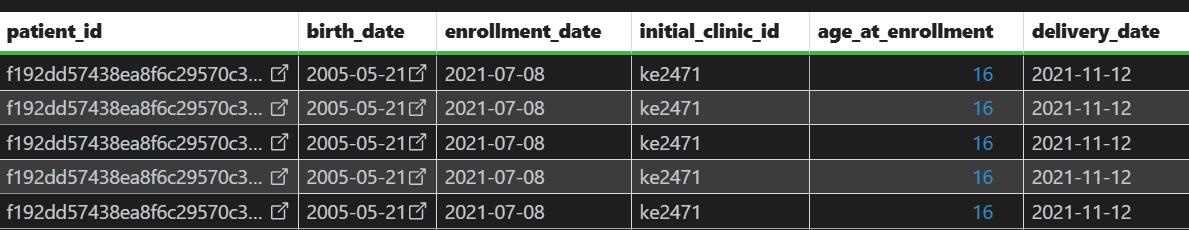
ON pi.patient_id = pt.patient_idThe table below is an output from the code above and shows part of the patient_timeline_combined table
Value-Points Calculation
There are three models that are used in calculating the value points for the different indicators: early ANC, full ANC profile, ultrasound, 4 ANC’s, facility based delivery and 2 PNC’s.
The tables resulting from these calculations serve as the basis for the tables used to create the dashboard visualizations. The models are located at: models/value_points/indicator_base
events_timeline: The model captures records of every visit for each mother along with the corresponding “actions” (or services) performed in each visitpatient_list: The model tracks the journey date range for each mother based on their expected delivery datevalue_points_config: The model contains all the configuration settings for the different indicators and is used bypatient_points_base.sqlandvalue_points_base.sql. For every indicator, the relevant configurations are collected from this file and then used in other queriesvalue_points_base: The model calculates the number of value points that are obtained, missed or can still be obtained per clinic, patient and indicator. This model is based on models 1,2 and 3 above
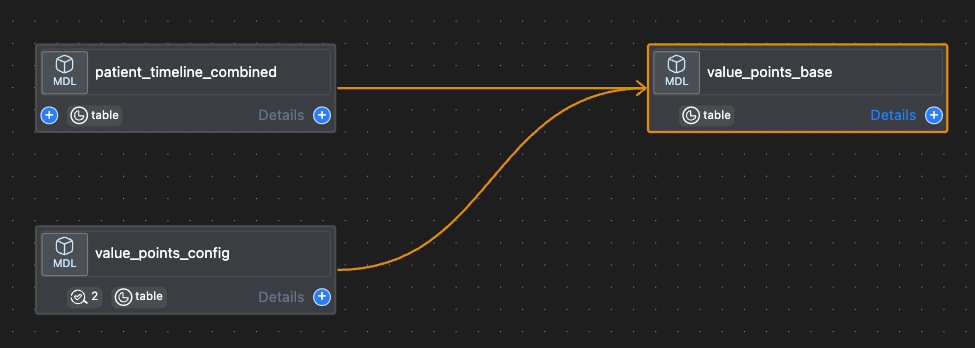
The tables below show some of the columns from the value_points_base model.
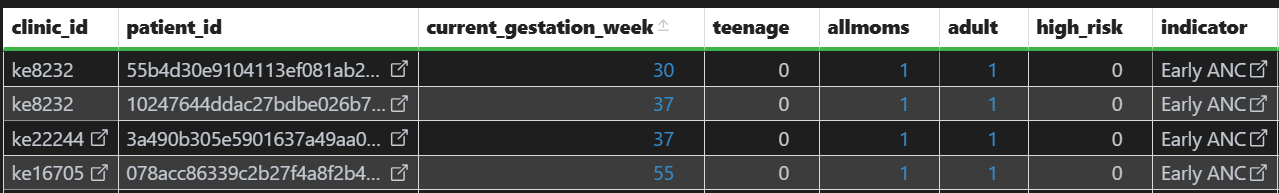
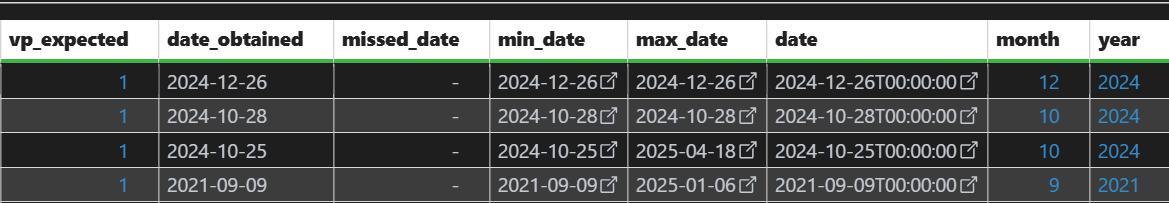
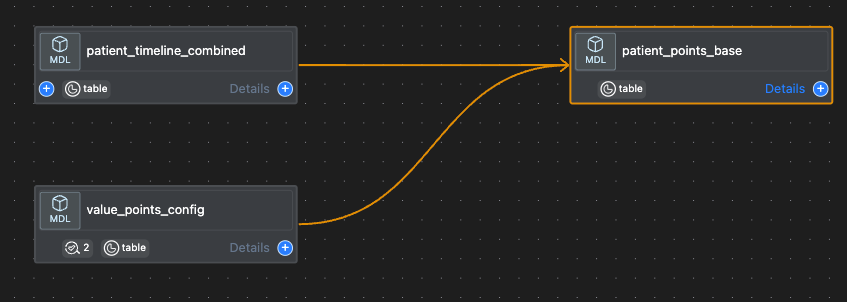
patient_points_base: The model calculates the number of patients that have missed or received the services corresponding to a certain indicator, or are still able to receive those services, per clinic and indicator. The model is derived of fromvalue_points_base