Architecture
In many low- and middle-income countries (LMICs), FHIR has emerged as the de facto interoperability standard, and implementers often adopt the OpenHIM platform as illustrated below.
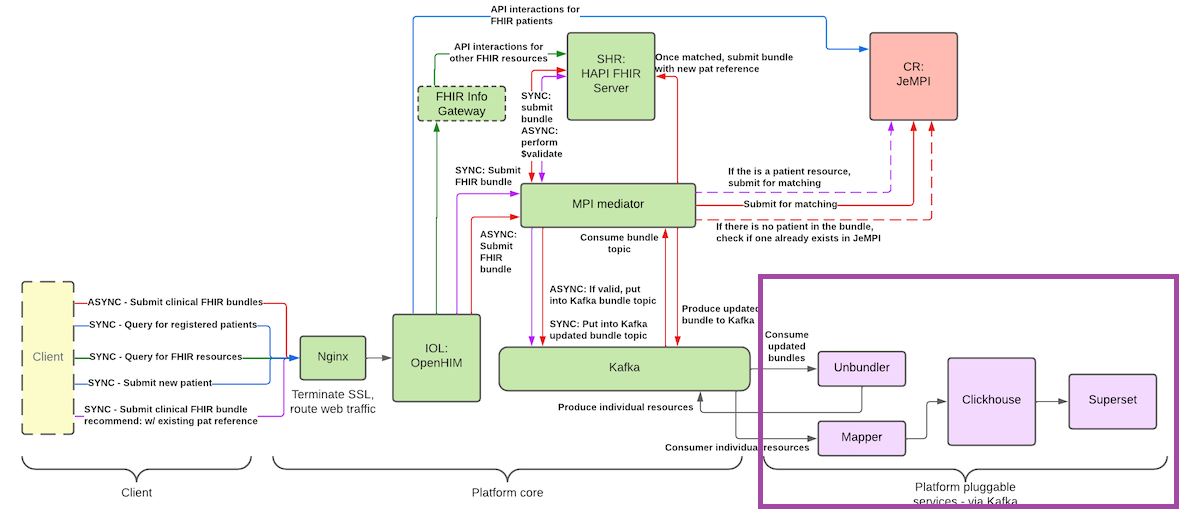
This guide focuses on the purple-highlighted segment, presenting an alternative analytics pipeline. The approach will be demonstrated by generating metrics for the ValuePoints dashboard.
Key Concepts
The analytics architecture is underpinned by three core concepts:
ETL Pipeline
The Extract–Transform–Load (ETL) pipeline coordinates the ingestion of FHIR resources, their transformation into analytics-ready structures, and subsequent loading into the metrics layer. This process converts complex clinical data into actionable metrics for dashboarding and reporting.Query Simplification
Deeply nested FHIR resources present challenges for traditional SQL queries. To overcome this, the community has embraced SQL-on-FHIR techniques that flatten hierarchical data into relational views. This simplification streamlines querying and enables efficient extraction of insights using standard SQL tooling.Metrics Layer
Once FHIR data has been flattened via SQL-on-FHIR, dbt manages the transformation logic that constructs longitudinal patient timelines. By leveraging modular, version-controlled SQL models, dbt assembles the records needed to compute ValuePoints metrics for dashboards and reports.
Implemented Architecture
The ValuePoints analytics pipeline is organized into five interconnected layers, each optimized for scalability, reliability, and ease of maintenance:
Orchestration (Prefect)
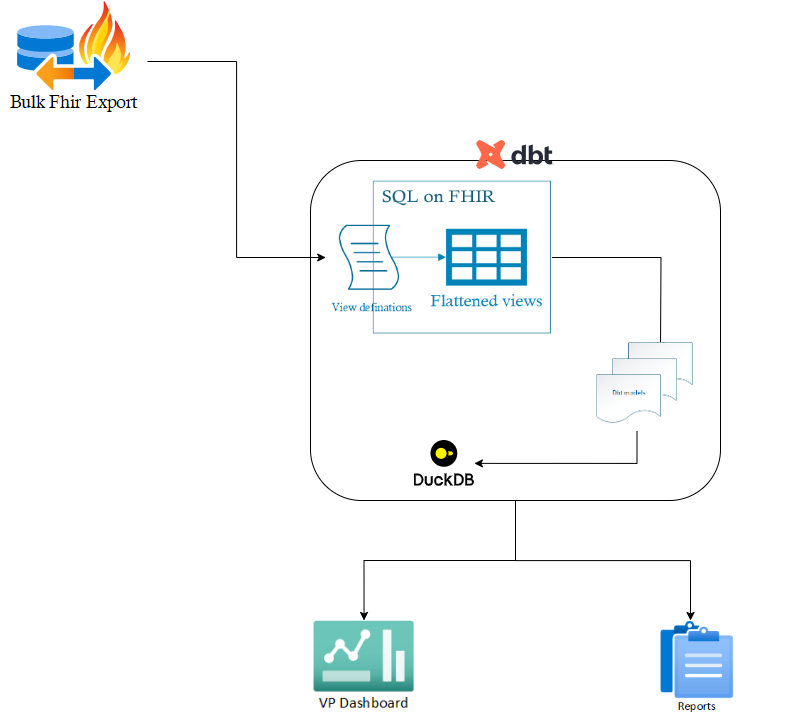
Prefect coordinates every step of the workflow—from Bulk FHIR export through flattening, transformation, and downstream metric materialization. Its Python‐based tasks, configurable scheduling, and built-in retry logic ensure robust and fault-tolerant execution.Data Flattening (SQL-on-FHIR + dbt)
- SQL-on-FHIR views ingest raw, nested FHIR resources and expose them as relational tables.
- dbt version-controls these view definitions, applies schema tests, and generates documentation, guaranteeing consistency and traceability.
- SQL-on-FHIR views ingest raw, nested FHIR resources and expose them as relational tables.
Metrics Layer (dbt Models)
Once data is flattened, a second set of dbt models constructs longitudinal patient timelines and computes the ValuePoints metrics. This modular, SQL-centric approach makes it easy to add, modify, or review metric logic under version control.Analytical Store (DuckDB)
All flattened views and metric tables are persisted in DuckDB, a lightweight, embeddable OLAP engine. DuckDB delivers fast ad-hoc querying without the overhead of a full data-warehouse, making local development and testing seamless.Visualization & Reporting
- Dashboards: The computed metrics power interactive dashboards (e.g. the Shiny-based ValuePoints Dashboard), enabling stakeholders to explore trends in real time.
- Reports: Scheduled exports of key metrics drive automated reporting, ensuring program managers and clinicians receive timely insights.
- Dashboards: The computed metrics power interactive dashboards (e.g. the Shiny-based ValuePoints Dashboard), enabling stakeholders to explore trends in real time.
This architecture combines open-source technologies to deliver an end-to-end solution—automating FHIR data ingestion, flattening, transformation, and visualization—to support value-based care programs with real-time analytics.
Tools and technologies
| Tool | Version | Role | Key Configurations |
|---|---|---|---|
| Prefect | 3.x | Orchestration & scheduling | Schedules, retries, notifications |
| dbt | 1.9 | SQL-based transformations & docs/tests | models/, tests/, docs/ |
| DuckDB | 1.x | In-memory analytical database | File‐backed .duckdb |
| Dashboards | — | Visualization & KPIs | Data sources, filters, alerts |